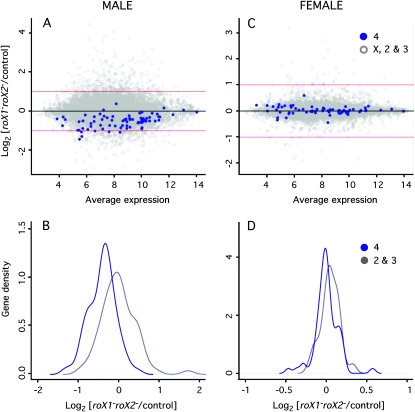
Figure 1.—
Expression of the fourth chromosome is reduced in roX1 roX2 males. (A) In roX1 roX2 males the expression of fourth-linked genes (blue) decreases in comparison with the rest of the genome (gray). Points represent the log2 of the ratio of gene expression in roX1SMC17AroX2 males to control males (roX2) plotted against expression level (log2 absorbance). Numbers and types of genes plotted are 9880 nonfourth-linked genes and 74 fourth-linked genes. (B) The density distribution of log2 expression (mutant/control) for fourth-linked genes (blue) and second and third chromosome genes (gray) in males. The distribution of fourth-linked genes differs significantly from the remaining autosomal genes (adjusted P-value < 6.6 × 10⁻¹⁶; Wilcoxon test). (C) In roX1 roX2 females the expression of fourth-linked genes (blue) is unchanged. The rest of the genome is shown in gray. Data is presented as the log2 of the ratio of gene expression in roX1SMC17AroX2 females to control females (roX1SMC17AroX2; [w+Hs83- roX1+]) plotted against expression level (log2 absorbance). Genes contributed to this analysis are 8433 nonfourth-linked and 69 fourth-linked genes. (D) The density distribution of log2 expression (mutant/control) for fourth-linked genes (blue) and second and third chromosome genes (gray) in female larvae. The distribution of fourth-linked genes is not significantly different from that of the second and third chromosomes (adjusted P-value 0.92). Only genes present in at least two out of three replicates were included. See File S1 for details of microarray hybridization and analysis.

