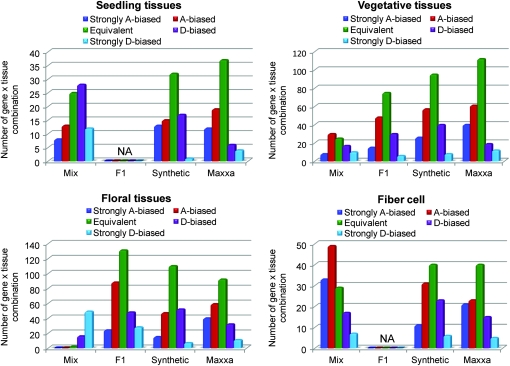
Figure 2.—
Distribution of genome-specific expression states among accessions and within different tissue categories. Each panel represents a tissue category and shows histograms for the mix F1, synthetic, and Maxxa. The expression categories correspond to the following values: strongly A biased (0–20% D expression); A biased (20–40% D expression); equivalent (40–60% D expression); D biased (60–80% D expression); strongly D biased (80–100% D expression). The y-axes indicate the number of gene-by-tissue combinations that fell under each category. NA, tissue type not available.

