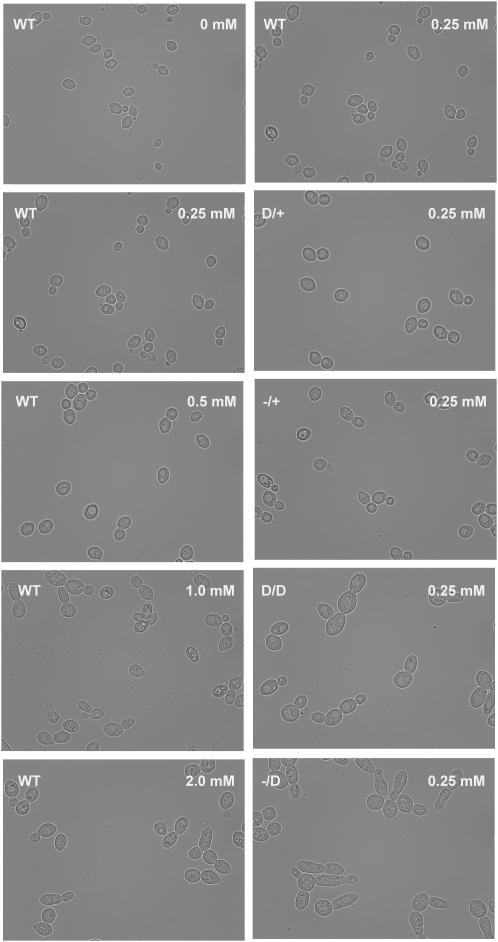
Figure 3.—
Morphological comparison of gene-dosage response to drug-dosage response: morphology of the wild-type strain treated with different concentrations of methotrexate in YPD medium (left column) and morphology of different DFR1 gene-dose strains grown in 250 μm of methotrexate (right column). Cells were grown in YPD with or without methotrexate at 30° for 2 days. Cells were then harvested and observed live with a Zeiss Axiovert 200 microscope using a 63× objective. Images were collected using bright field illumination, using an Axiocam HR.

