
Figure 5.
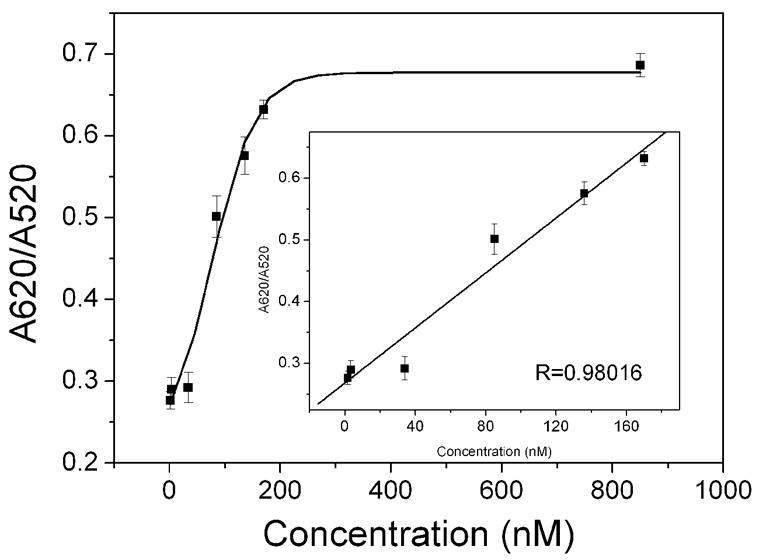
Plot of the absorbance ratio (A620/A520) for the scFv-cys stabilized gold NPs solution at 30 min as a function of the concentration of rabbit IgG. Inset is the linear curve at low concentration of rabbit IgG. (n = 3)
Official websites use .gov
A
.gov website belongs to an official
government organization in the United States.
Secure .gov websites use HTTPS
A lock (
) or https:// means you've safely
connected to the .gov website. Share sensitive
information only on official, secure websites.
Plot of the absorbance ratio (A620/A520) for the scFv-cys stabilized gold NPs solution at 30 min as a function of the concentration of rabbit IgG. Inset is the linear curve at low concentration of rabbit IgG. (n = 3)