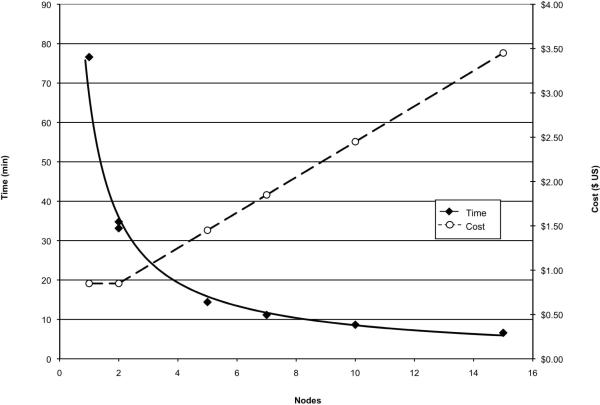
Figure 3.
Time and Cost of Different ViDAC Configurations
Wall clock time to complete the analysis is indicated in filled diamonds and solid lines. Cost of analysis is indicated by open circles and dashed lines. The number of nodes is the total number of nodes functioning as both the head node and as worker nodes. Data from two independent runs for a two node clusters is shown. Costs are in US dollars as of 11/1/2008.

