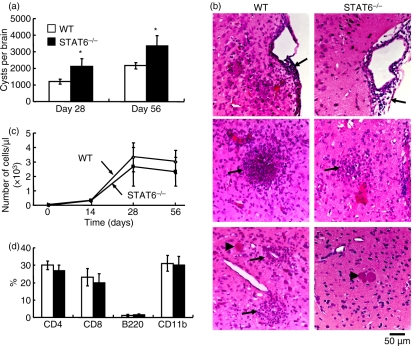
Figure 1.
Cyst burden, histopathological findings and immune responses in the brain. (a) Brains were removed on days 28 and 56 pi, and the number of cysts was counted under a microscope. Data are expressed as mean ± standard deviation (SD) (n = 5). Similar results were obtained from five replicate experiments. (b) Representative photographs of the brain on day 28 post-infection (pi) are shown. Sections were fixed and stained with haematoxylin and eosin. Arrows indicate cellular infiltration in the subarachnoid space and cerebral cortex. Arrow heads indicate Toxoplasma gondii cysts. Note that the area of inflammation is wider in wild-type (WT) than in STAT6−/− mice. (c) Cerebrospinal fluid (CSF) was obtained from uninfected and infected mice on days 14, 28 and 56 pi. Nucleated cells were stained with Turk solution, and the total number of cells was counted. (d) Classification of cells in CSF was determined by flow cytometric analysis. Data are expressed as mean ± SD (n = 5). Similar results were obtained from three replicate experiments. *Significantly different from WT mice (P <0·05).

