Figure 2.
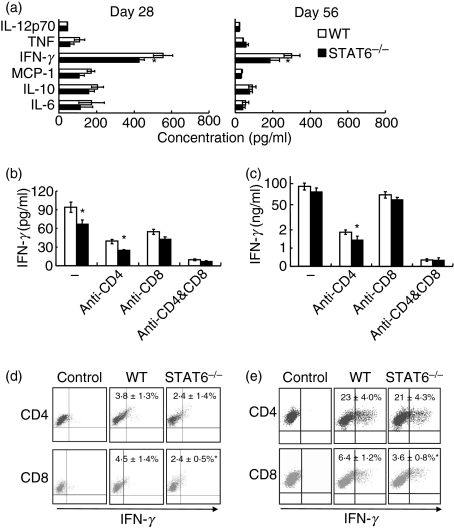
Production of interferon (IFN)-γ by T cells in the cerebrospinal fluid (CSF) and spleen. (a) CSF was taken from signal transducer and activator of transcription (STAT) 6−/− and wild-type (WT) mice on days 28 and 56 post-infection (pi). Concentrations of cytokines in CSF were determined using a cytometric bead array (CBA) kit. IFN-γ level was significantly lower in STAT6−/− as compared with WT mice. Data are mean ± standard deviation (SD) (n = 5). CSF cells (b) and splenocytes (c) were taken from STAT6−/− and WT mice on day 28 pi, and were incubated with Toxoplasma gondii antigen. Anti-CD4 and/or anti-CD8 monoclonal antibodies (mAbs) (5 μg/ml) were added to the culture to block activation of CD4+ and/or CD8+ T cells. The IFN-γ concentration in culture supernatants was determined using a CBA kit. Data are mean ± SD (n = 5). CSF cells (d) and splenocytes (e) were incubated with T. gondii antigen, and stained for T-cell markers and IFN-γ. Cells without antigen stimulation were used as a control. Numbers indicate the percentage of IFN-γ-producing cells in CD4+ and CD8+ T cells. Data are mean ± SD (n = 5). Experiments were carried out three times with similar results. *Significantly different from WT mice (P <0·05).

