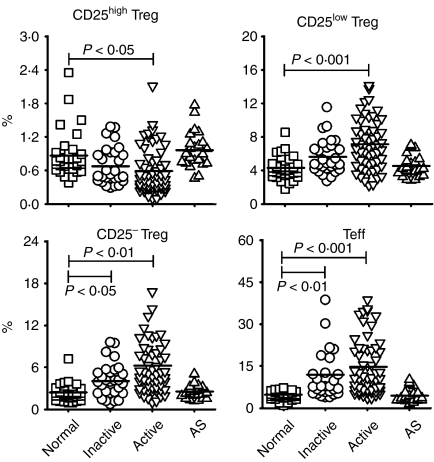
Figure 2.
The percentages of different regulatory T-cell (Treg) subsets and effector T cells (Teffs) in patients with systemic lupus erythematosus (SLE) and in healthy controls. The results are shown as percentages of CD25high Tregs, CD25low Tregs, CD25− Tregs and Teffs in normal controls (n = 36), in patients with inactive SLE (n = 29), in patients with active SLE (n = 58) and in patients with ankylosing spondylitis (AS) (n = 23). Symbols represent the frequencies of Treg subsets and Teffs in individual samples. The line within the vertical points marks the mean for each group. A P-value of<0·05 was considered as significant following analysis of the results using a general linear model adjusted for gender and age. See Fig. 1 for other definitions.

