Figure 1.
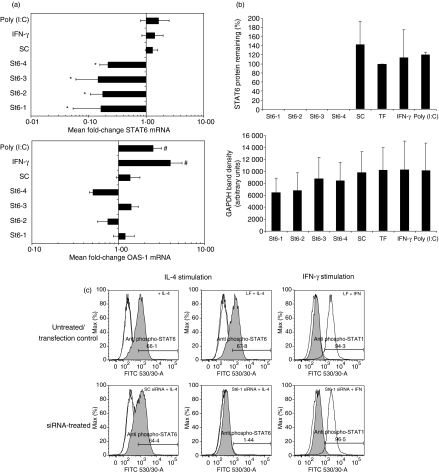
Signal transducer and activator of transcription 6 (STAT6)-targeting small interfering RNAs (siRNAs) specifically down-regulate STAT6 gene expression without inducing cellular interferon (IFN) responses. A549 cells were transfected with four STAT6-targeting (St6-1, St6-2, St6-3 and St6-4) and scrambled control (SC) siRNAs (20 nm) as described in the text. As controls for IFN response induction, parallel cultures were stimulated in the presence of 50 ng/ml IFN-γ or 10 μg/ml poly (I:C) for 72 hr. (a) Real-time reverse transcription–polymerase chain reaction (RT-PCR) analysis demonstrated significant down-regulation of STAT6 mRNA expression in cells treated with STAT6-targeting siRNA compared with cells treated with SC siRNA (*P ≤ 0·05). Analysis of 2′5′-oligoadenylate synthetase (OAS)-1 expression by RT-PCR showed that only cells treated with IFN-γ or poly (I:C) exhibited significant up-regulation of OAS-1 mRNA expression compared with siRNA-treated cells (#P ≤ 0·05). (b) Densitometry data from western blot experiments (n = 3) illustrating loss of detectable STAT6 protein expression in cells treated with STAT6-targeting siRNA (top panel), 72 hr post-treatment. TF, transfection reagent control. The lower panel shows that mean GAPDH levels (band densities) were not significantly different in siRNA-treated versus non-siRNA-treated cultures (P ≥ 0·05). (c) Flow cytometric analysis of staining with phospho-STAT6 (shaded histograms) or phospho-STAT1 antibodies (unshaded histograms). Cells treated with transfection reagent (LF) or SC siRNA exhibited interleukin (IL)-4 responsiveness (phospho-STAT6 staining) comparable with that of untreated cells (top left panel). In contrast, cells pretreated with STAT6-specific siRNA (representative data showing St6-1 treatment) did not exhibit detectable STAT6 phosphorylation upon stimulation with IL-4. STAT1 activation was only detectable in cultures treated with IFN-γ.

