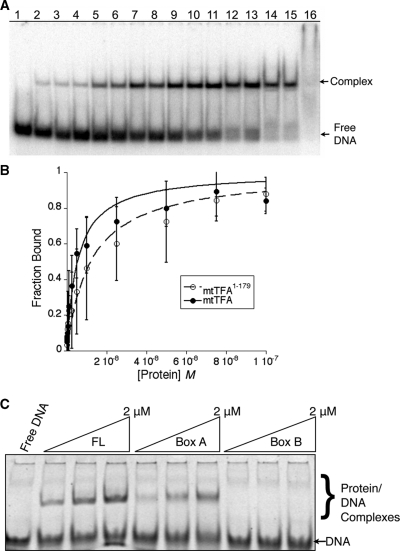
Figure 3.
Contributions of regions of human mtTFA to DNA binding. (A) Representation of typical EMSA used for binding curve analysis. Lane 1 contains no protein: lanes 2 through 16 contains increasing amounts of protein from 0.5 to 1000 nM. (B) Binding curves for mtTFA and mtTFA1–179 with error bars. (C) EMSA using 3 μM 30 bp LSP DNA with increasing concentrations of h-mtTFA, box A (mtTFA1–79) or box B (mtTFA110–179).

