Figure 5.
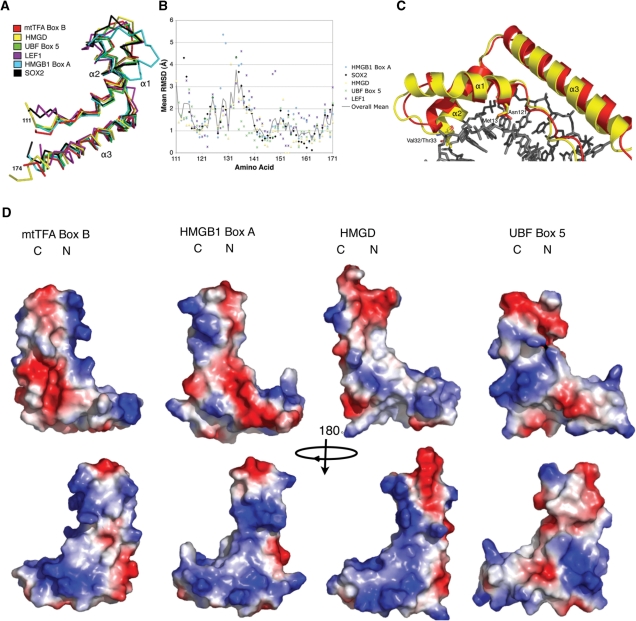
Comparison of human mtTFA box B with other HMGB proteins. (A) Structural superposition of box B of h-mtTFA (3fgh; red) overlaid with HMGD (1qrv; yellow), UBF box 5 (2hdz; green), LEF1 (2lef; purple), HMGB1 box A (1ckt; cyan) and Sox2 (1gt0; black). (B) RMSD comparisons per amino acid were calculated using the program COOT, and were plotted against the amino acid sequence of h-mtTFA box B. The same color scheme was used as in (A). The solid line indicates the mean RMSD for the HMG boxes that were aligned. (C) Superposition of box B of h-mtTFA (red) on HMGD (yellow) in the HMGD–DNA complex and showing the shortened loop between helix α1 and α2 and the decreased size of helix α1. (D) Electrostatic surface potential plot of box B (mtTFA110–179), HMGB1 box A, HMGD, and UBF box 5 generated with PYMOL. Regions of positive potential are colored blue, and regions of negative potential are colored red.

