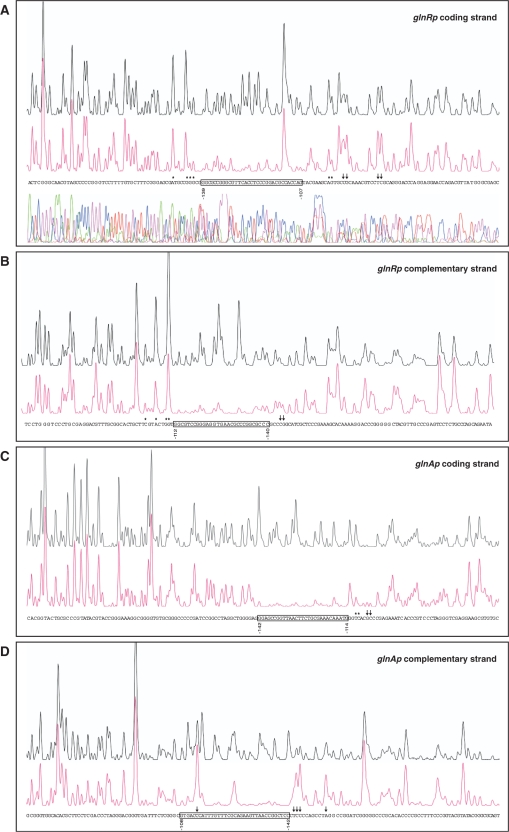
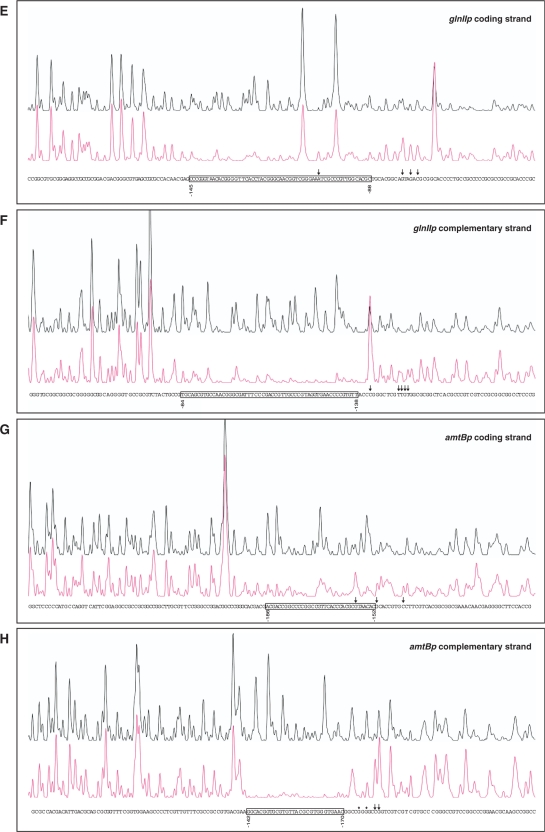
Figure 2.
DNase I footprints of the GST-PhoPDBD protein bound to the promoter regions of glnR (A, B), glnA (C, D), glnII (E, F) and amtB (G, H). In each panel, the upper electrophoregram (black line) is the control reaction. The protected nucleotide sequence is boxed; partially protected nucleotides (*), and hypersensitive sites (arrows) are also indicated. Sequencing reactions are not included except in panel A. Coordinates are from the translation start codon.


