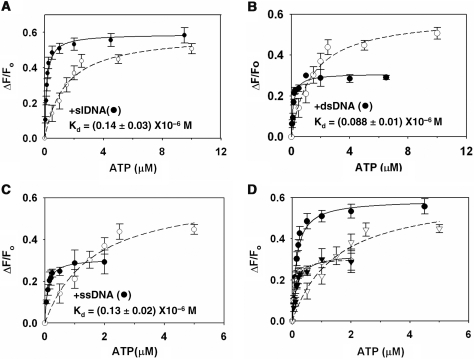
Figure 3.
Binding of ATP to ADAAD in presence of saturating concentration of DNA. (A) ADAAD was saturated with 3 μM slDNA. (B) ADAAD was saturated with 4 μM dsDNA. (C) ADAAD was saturated with 6 μM ssDNA. In all the graphs: (open circle) titration of ATP in absence of DNA and (filled circle) titration in presence of DNA. (D) Comparison of ATP binding to ADAAD in presence and absence of DNA. (open circle) absence of DNA, (filled circle) presence of slDNA, (open inverted triangle) presence of dsDNA and (filled inverted triangle) presence of ssDNA.

