Figure 8.
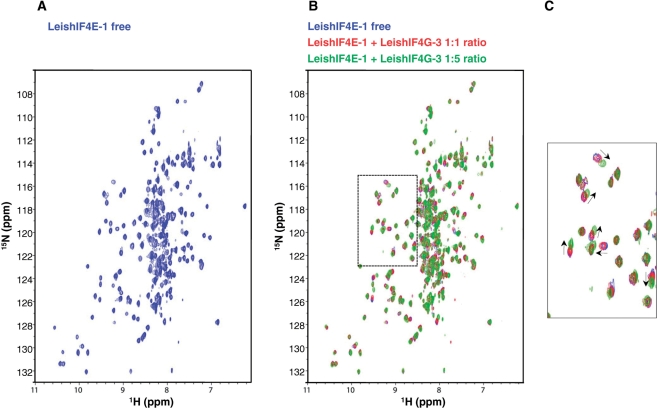
Binding of a LeishIF4G-3 peptide to LeishIF4E-1. (A) 15N, 1HTROSY-HSQC spectra of 15N-labeled LeishIF4E-1 (250 µM) in the presence of m7GTP (5 mM) for stabilization (LeishIF4E-1 free, in blue). (B) Overlays of 15N, 1HTROSY-HSQC spectra of 15N-LeishIF4E-1 free with increasing amounts of non-labeled LeishIF4G-3 peptide (NYLEPPYPGFSLDEVVRR). The concentrations of the LeishIF4G-3 added were 0 µM (blue, ratio 1:0), 250 µM (red, ratio 1:1) and 1.25 mM (green, ratio 1:5). (C) Enlargement of a region displaying the chemical shift differences between the spectra that is boxed in (B) in dashed lines. Peaks movements are indicated by arrows.

