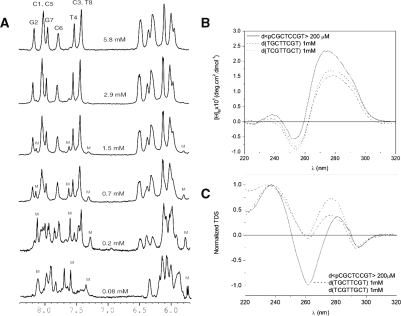
Figure 1.
The 1D NMR spectra of d<pCGCTCCGT> in D2O at 5°C and different oligonucleotide concentrations (25 mM sodium phosphate buffer, pH 7, M stands for monomeric form) (A). CD (B) and TDS (C) spectra of d<pCGCTCCGT>, d(TGCTTCGT) and d(TCGTTGCT) (25 mM sodium phosphate buffer, pH 7, 100 mM NaCl, 10 mM MgCl2).

