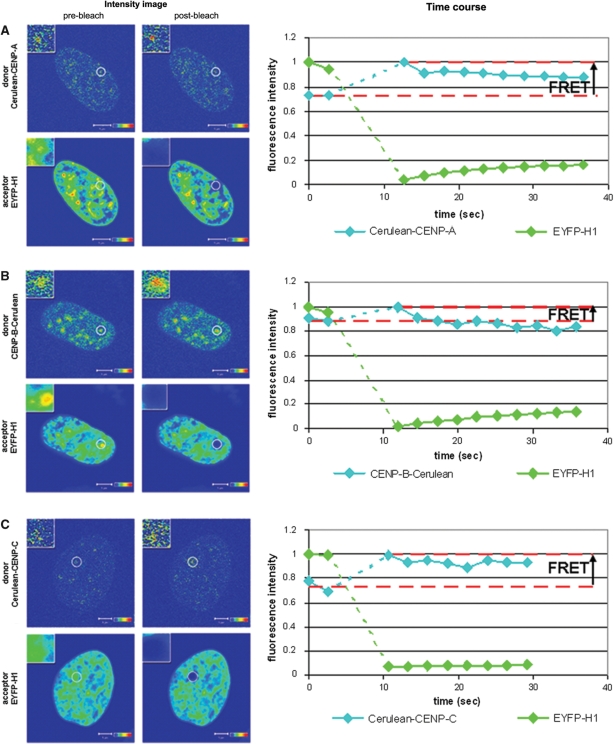
Figure 3.
Acceptor bleaching FRET in vivo reveals the presence of linker histone H1° at human centromeres. The column ‘Intensity image’ shows confocal images that were acquired in the donor channel (upper panels) and the acceptor channel (lower panels) before (left panels) and after (right panels) bleaching of the acceptor. Intensities are encoded by colour ranging from blue (low intensty) to red (high intensity). The analysed centromere is shown in the inserts at a magnified scale. The column ‘Time course’ shows a plot of the time course of the fluorescence intensities that were recorded in the donor (cyan line) and the acceptor (green line) channel. Data were averaged over the indicated ROI and normalized to the maximum of the averaged intensities obtained in the respective channel. The dotted green and blue lines mark the bleaching period. The horizontal dashed red lines indicate the mean of the donor fluorescence intensities of the two measurements performed before photobleaching of the acceptor (IDA) and donor intensity recorded in the first image after acceptor photobleaching (ID). (A) Acceptor photobleaching of centromeres that contained Cerulean-CENP-A/EYFP–H1°, (B) CENP-B-Cerulean/EYFP-H1° or (C) Cerulean-CENP-C/EYFP-H1°. In all experiments, acceptor photobleaching resulted in an increase of the donor fluorescence intensity. This indicates that FRET occurs between the donor and acceptor fluorophores and that the respective proteins are in close vicinity to each other (<10 nm). Bars = 5 µm.

