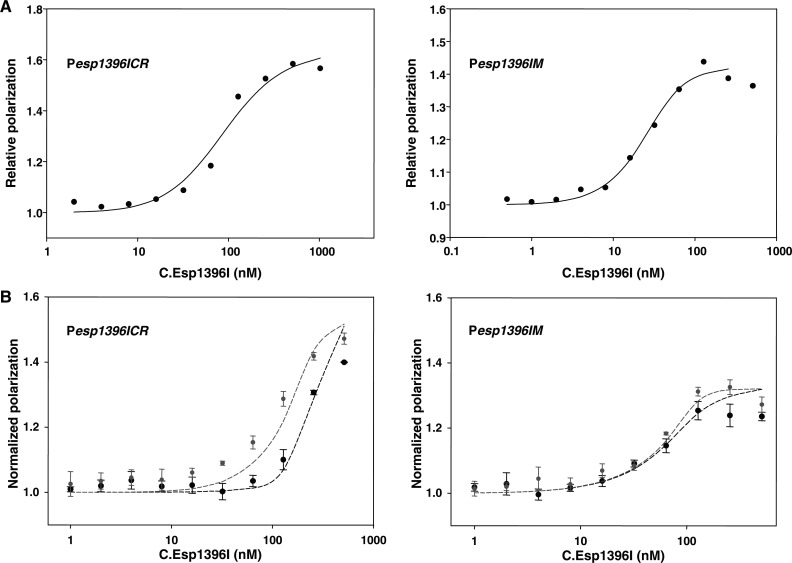
Figure 6.
Interaction of C. Esp1396I with esp1396I binding sites measured by fluorescence polarization. (A) DNA binding of C.Esp1396I analyzed by fluorescence polarization of fluorescein-labeled Pesp1396ICR (left) and Pesp1396IM (right) DNA fragments. Solid lines show best fits of the models to experimental data. The best fit parameters for Pesp1936ICR were Kp = 322 nM, Kd = 6.9 nM and cooperativity 219. The best fit equilibrium constant for Pesp1936IM DNA was K = 0.3 nM. (B) Left panel: binding of C.Esp1396I to labeled Pesp1396ICR DNA in the absence (gray symbols) and presence (black symbols) of unlabeled Pesp1396IM DNA. Right panel: binding of C.Esp1396I to labeled Pesp1396IM DNA in the absence (gray symbols) and presence (black symbols) of unlabeled Pesp1396ICR DNA. Both labeled and competing unlabeled DNA (when present) were at 50 nM. Dashed lines depict predicted simulated binding using equilibrium constants derived from the analysis of the data illustrated in (A).

