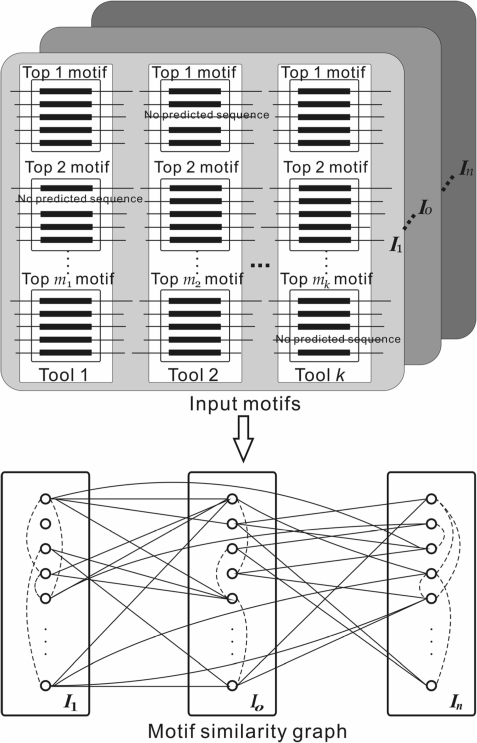
Figure 2.
Construction of the motif similarity graph. Multiple (k) motif-finding tools are used and each predicts multiple motifs in each inter-operonic sequence set Io. All the predicted motifs form the set of input motifs. A node in the motif similarity graph represents a motif. Two nodes are connected if their corresponding motifs have a similarity score ≥β with the score being the weight on the edge (not shown for clarity). A solid line represents an edge between two nodes associated with two different Io, and a dashed line represents an edge between two nodes associated with the same Io.

