Figure 3.
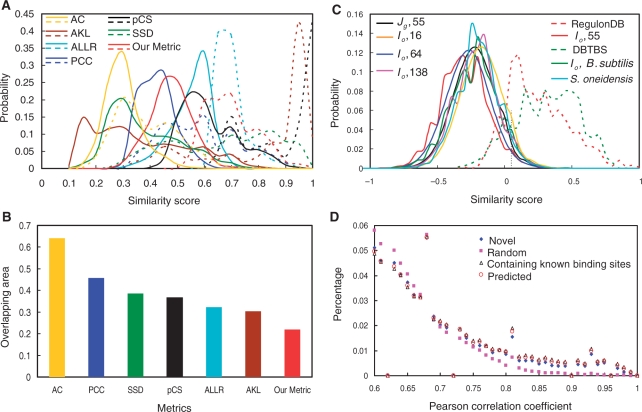
The distributions motif similarity scores. (A) Comparison of the distributions of motif similarity scores computed by average Kullback–Leibler (AKL), average log-likelihood ratio (ALLR), Pearson correlation coefficient (PCC), 1 − P-value of Chi-square (pCS), sum of squared distance (SSD), asymptotic covariance (AC), and our metric. The alignment defined by our method (see ‘Materials and Methods’ section) between two motifs was used to compute the similarity scores by all the metrics. The scores computed by each metric were normalized to their maximal values. The solid lines are the distributions of the motif similarity scores among the input motifs in E. coli K12. The dashed lines are the distributions of the motif similarity scores among the sub-motifs of known binding sites in RegulonDB. (B) The overlapping area between the distribution curve of the similarity scores among the input motifs and that of the similarity scores among the sub-motifs of known motifs in RegulonDB. (C) Effects of the selection of reference genomes and the way of grouping inter-operonic sequences on the distribution of the similarity scores among the input motifs. The dashed lines are the distributions of the motif similarity scores among the sub-motifs of the known binding sites in RegulonDB or DBTBS. The vertical dotted line indicates the point of the similarity score cutoff β = 0.05 used for constructing the initial motif similarity graphs. (D) Distributions of the absolute values of Pearson correlation coefficient scores of the expression vectors of each pair of genes in each of the top 400 predicted clusters/regulons in E. coli K12 and that of randomly selected 400 gene groups with the corresponding numbers of genes in the top 400 predicted clusters/regulons.

