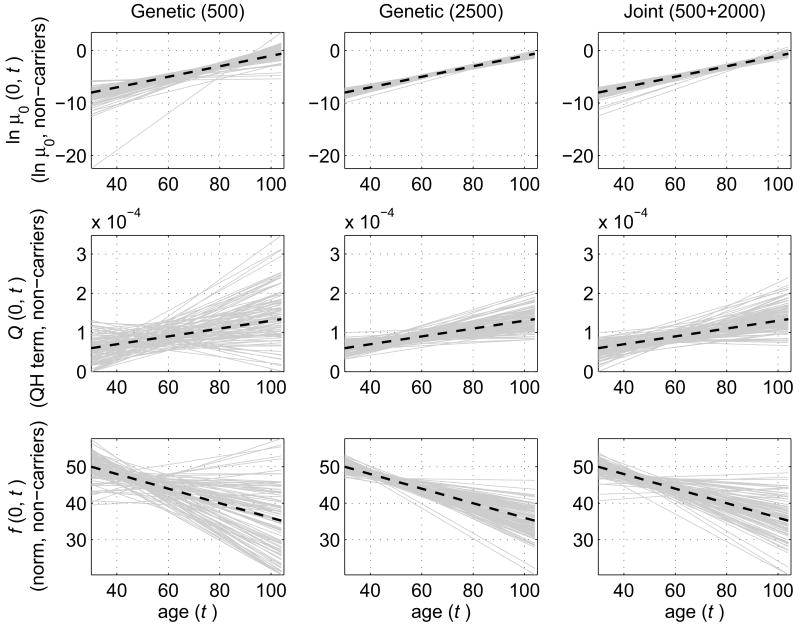
Fig. 2.
Simulation study: Comparison of estimates for non-carriers of a hypothetical allele (genotype) obtained in 100 simulated data sets by three methods. Left column: Estimates of age trajectories (solid grey lines) of logarithm of baseline hazard (ln μ0 (0,t) ), quadratic hazard (QH) terms (Q(0, t)), and age-dependent norms (f(0, t)) calculated using only sub-samples with genetic information (500 individuals). Middle column: Similar estimates when the entire sample (2500 individuals) contains genetic information. Right column: The estimates calculated using the joint analysis of genetic (500 individuals) and non-genetic (2000 individuals) data. Respective “true” trajectories used for simulation of data are shown as dashed black lines; t denotes age.

