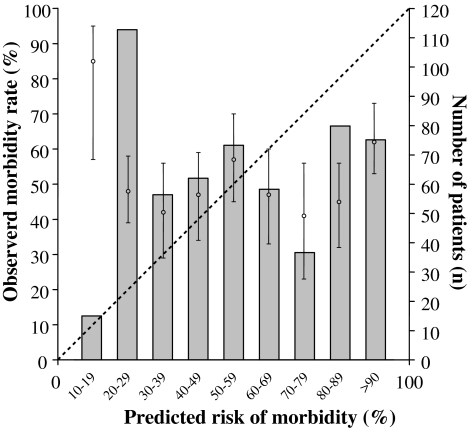
Fig. 1.
Calibration curve of surgical morbidity (symbols with 95% confidence interval) showing significant deviation from the diagonal line, which represents a perfect predictive ability when the observed to expected ratio is 1.00. The bars represent the number of patients in each risk group. (O:P ratio = 0.88, χ2 = 30.24, 8 degrees of freedom, P < 0.001, indicating significantly poor fit)

