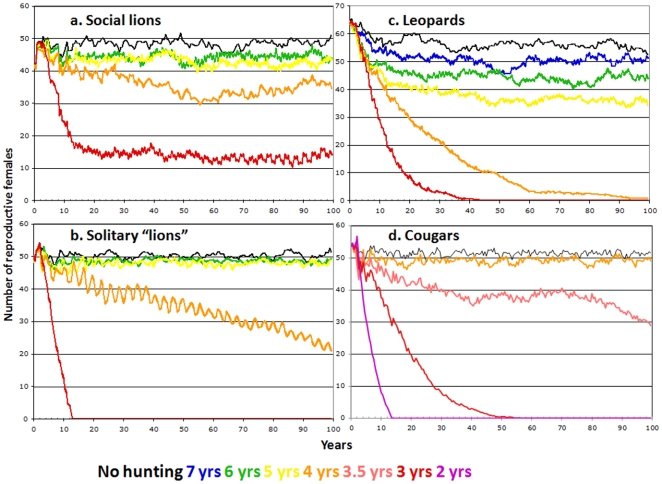
Figure 1. Average number of adult females in population simulations where all eligible males are removed during a 6-mo hunting season each year for 100 yrs.
Colors indicate outcomes for different age minima for trophy males; each line indicates average from 20 runs. A. Population changes for “social lions” follow the assumptions and demographic variables in ref. [1] except to restrict hunting to 6-mo seasons and to incorporate additional details of dispersal, survival and reproduction [44]–[46]. B. Population changes for a hypothetical lion population where males and females are solitary and each territorial male controls one female. C. Population changes for leopards based on long-term data from Phinda Private Game Reserve [33], [47] and other sources [37], [48]. D. Population changes for cougars based on demographic data from refs. [27], [49]–[53].

