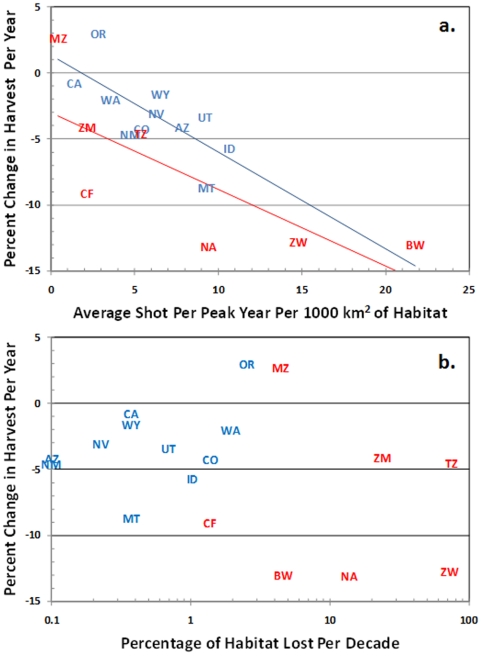
Figure 3. Recent trends in cougar offtakes (blue) and lion offtakes (red) as functions of a) harvest intensity and b) habitat loss.
Jurisdictions with the highest harvest intensity showed the greatest decline in cougar offtakes (r2 = 0.5151, P = 0.0129) and lion offtakes (r2 = 0.5796, P = 0.0468). Habitat loss is plotted on a log scale to allow comparison between the African countries and the US states.

