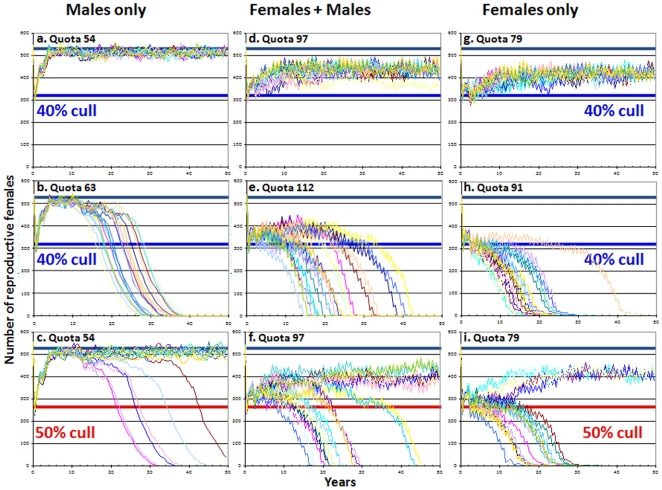
Figure 4. Simulated cougar populations subjected to an initial cull followed by fixed offtakes for 50 yrs.
The initial cull is either 40% (top and middle rows) or 50% (bottom row), and the subsequent harvests are either the maximum offtake that incurred no extinctions in 20 runs following a 40% cull (top and bottom rows) or the minimum that produced 20 extinctions in 20 runs following a 40% cull (middle row). In the absence of sport hunting, the stable population size in these simulations is 527 reproductive females (indicated by the heavy black line in each graph); a 40% reduction in population size is indicated by blue lines, a 50% reduction by red lines. Each column represents a different harvest strategy: male only (left column), males and females (middle) and female only (right). Demographic parameters are set as in Fig. 1; quotas allow offtake of animals as young as 2 yrs; each graph shows outputs from 20 runs.

