
Fig. 1.
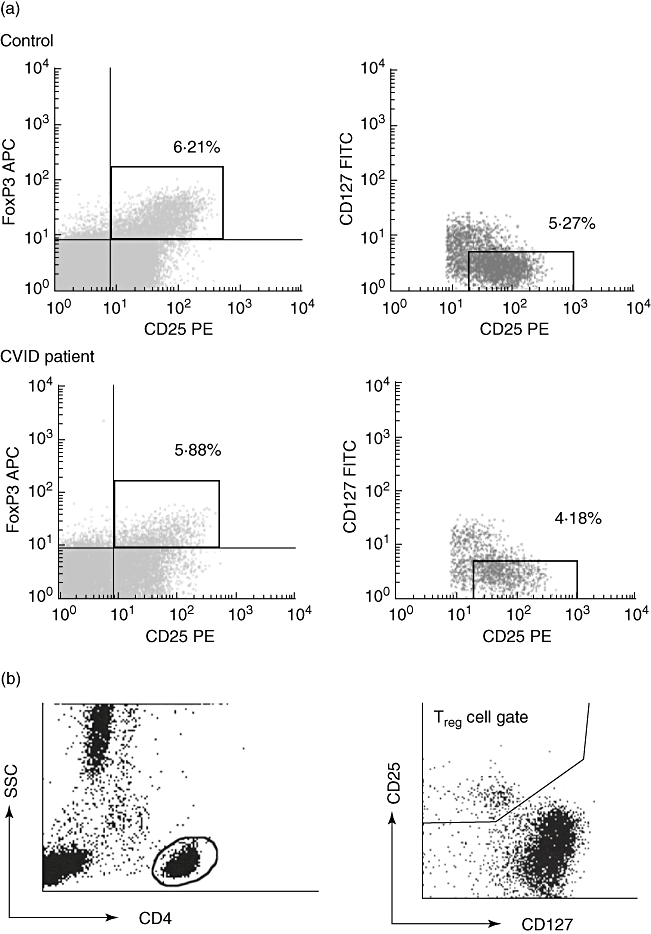
Gating strategy for the identification and phenotypic analysis of regulatory T cells (Treg) in healthy controls and common variable immunodeficiency (CVID) patients. (a) Representative plots from a control patient (upper plots) and a CVID patient (lower plots) based on fixed and permeabilized cells as used in the London and Freiburg cohorts. Analysis gates have been restricted to the lymphocyte population by means of their forward and side light-scatter characteristics, with subsequent gating on CD4+ lymphocytes to generate plots to enumerate CD25+/forkhead box P3+ cells (left panels); in the London cohort, subsequent gating excluded CD127 expressing cells (right panels). Percentages represent proportions of CD4 cells in the specified gate. (b) Analysis in fresh cells, as used in the Sydney cohort, with initial gating on CD4+ lymphocytes by scatter (left panel) followed by gating on CD25+/CD127low cells (right panel).