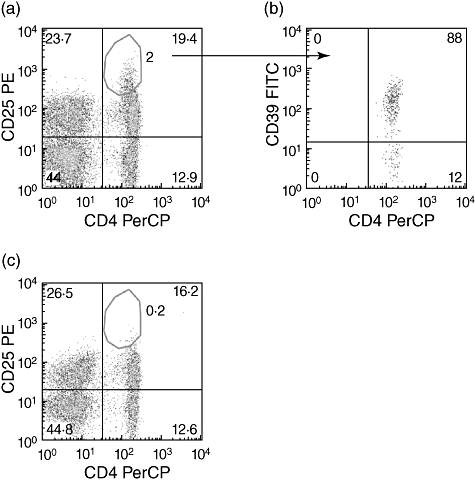
Fig. 4.

Flow cytometric analysis before and after depletion of T regulatory cells (Treg) from tuberculosis (TB) patients' peripheral blood mononuclear cells (PBMC). TB patients' PBMC were stained with CD4 and CD25 before (a) and after (c) depletion of Treg. CD39 expression was evaluated on gated CD4+CD25high T cells (b). Fluorescence activated cell sorter (FACS) analysis was performed as described in the Materials and methods section. Representative panels from one patient are shown. The percentage of Treg evaluated as CD4+CD25high in Treg-undepleted PBMC is 2% (a). Among them 88% are CD39+ (b). After Treg depletion the percentage of Treg is 0·2% (c).
