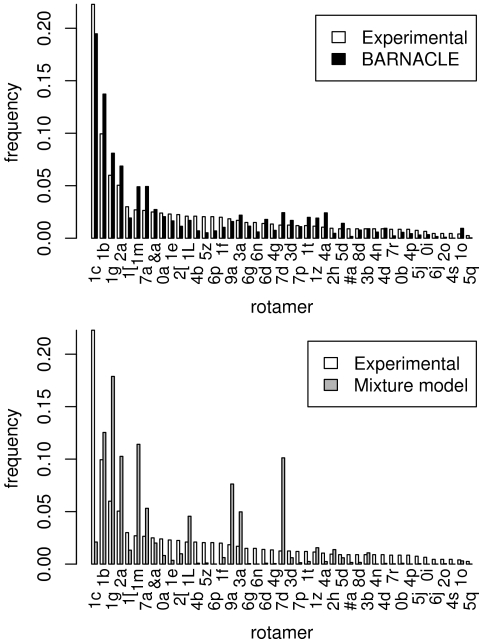
Figure 6. Histograms of the rotamer distributions in the non-helical regions.
The figure shows the distributions in the experimental data set (top and bottom), in the BARNACLE samples (top) and in the mixture model samples (bottom). The names of the rotamers, as defined by the RNA Ontology Consortium [31], are used as index on the horizontal axis. The rotamers are sorted along the horizontal axis according to their frequency in the experimental data set.

