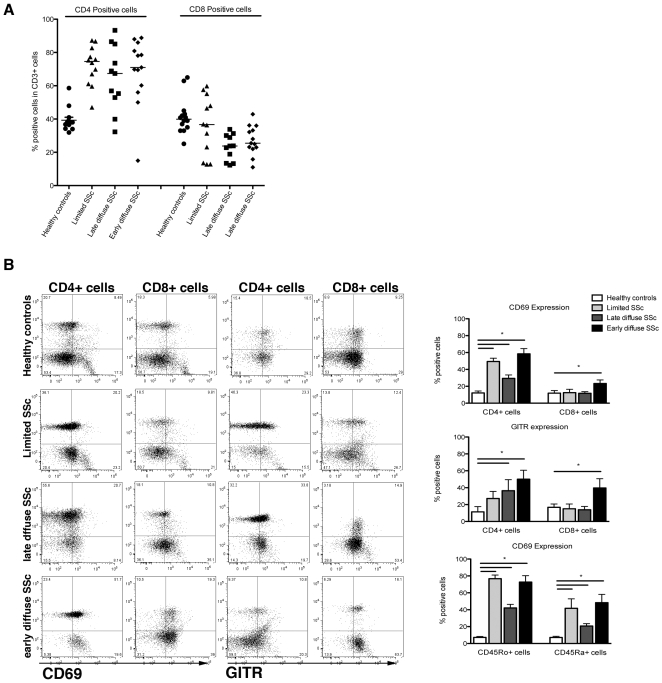
Figure 1. SSc patients have more and more activated CD4+ T cells compared to healthy controls.
Panel A depicts the percentage of CD4+ and CD8+ cells in the whole T cell pool (CD3+ cells) from healthy controls (n = 14), and SSc patients with the lcSSc (n = 12), ldcSSc (n = 11) and edcSSc (n = 13) phenotype. The CD3+ cells were isolated using MACS bead isolation after which CD4 and CD8 positivity was analyzed using flow cytometry. Panel B (left) depicts the percentage of CD4+ and CD8+ cells that were double-positive for the T cell activation markers CD69 and GITR. For this aim a representative individual from each group was selected. In the right panel, the percentage of CD4-CD69, CD8-CD69, CD4-GITR, CD8-GITR, CD45Ro-CD69 and CD45Ra-CD69 double positive cells is presented over the whole group of healthy donors (n = 14) and/or SSc patients (n = 36).

