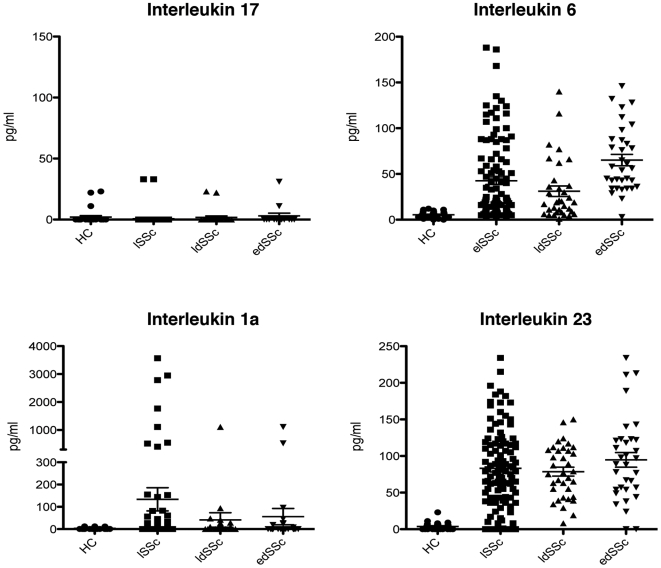
Figure 3. Increased level of Th17 inducing cytokines in the circulation of SSc patients.
Panel A depicts the presence of IL-17 in the circulation of SSc patients and healthy controls. Panel B, C and D represents the levels of IL-6, IL-1α and IL-23, respectively. The circulating levels of IL-17, IL-1α and IL-23 was measured by ELISA whereas IL-6 was studied by Bioplex assays.

