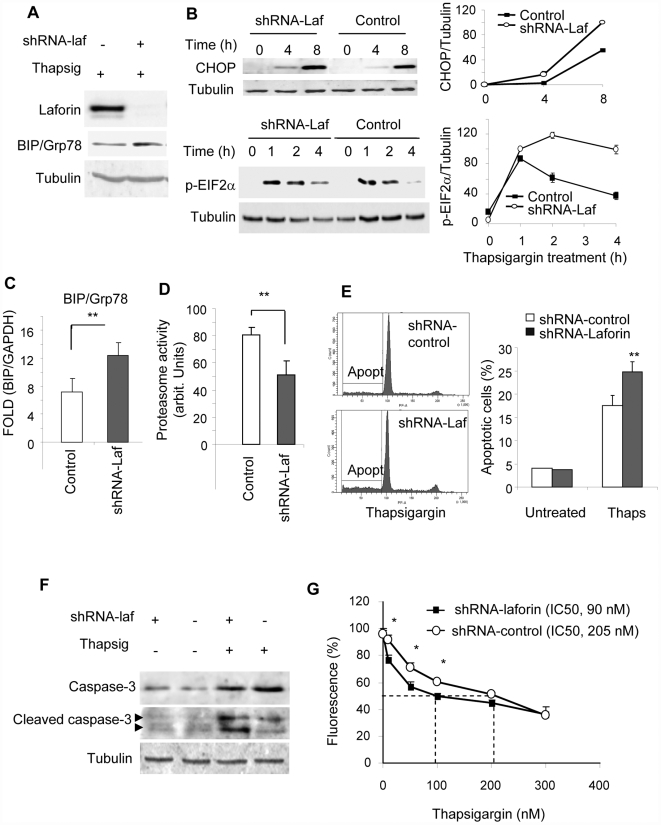
Figure 2. Lack of laforin enhances cell sensitivity to endoplasmic reticulum stress in human neuroblastoma SH-SY5Y cells.
SH-SY5Y cells were stably transfected with empty pSuper.neoGFP vector or pSUPER-laforin expressing a shRNA against laforin, as described in Materials and Methods. A) Stable transfectants were treated with 1 µM thapsigargin for 18 h and analyzed by western-blot using anti-BIP/Grp78, anti-laforin and anti-tubulin antibodies. B) The expression of additional ER-stress markers such as CHOP and pEIF2α (phospho-EIF2alpha) was analyzed in the stable transfectants at different times after the treatment with 1 µM thapsigargin (see Supplementary Fig. S1 for time course appearance of different ER-stress markers); right panel shows quantification (mean±SEM) of different blots expressed as percentage respect to tubulin lebels. C) Quantitative real time PCR analysis of the expression of BIP/Grp78 in stable transfectants treated with 1 µM thapsigargin for 18 h; expression of target gene was normalized using GAPDH as an internal control; data are expressed as fold induction over untreated control (mean±SEM) of four independent measurements. D) Proteasome activity was measured in extracts from transfectants used in A) treated with 1 µM thapsigargin. E) Growth of control and laforin depleted transfectants was assessed by flow cytometry as described in Materials and Methods. The percentage of apoptotic cells in the sub-G1 population was measured in cells treated or not with 1 µM thapsigargin for 18 h. The left panel shows a representative analysis of three independent experiments of cells treated with thapsigargin; the right panel shows the corresponding mean±SEM. F) Extracts from laforin-depleted and control cells treated or not with 1 µM thapsigargin for 18 h were analyzed by western-blotting using anti-caspase 3 and anti-activated caspase 3 antibodies; tubulin was used as a loading control. G) Cell sensitivity of laforin depleted and non-depleted cells to thapsigargin treatment. Stable laforin depleted SH-SY5Y and control cells were cultured in 96-well plates and treated with different amounts of thapsigargin for 24 hr. Then, cell viability was assessed using the AlamarBlue assay as described in Materials and Methods. Each point represents mean±SEM of three independent measurements and expresses the percentage of viability respect to the corresponding untreated cells.

