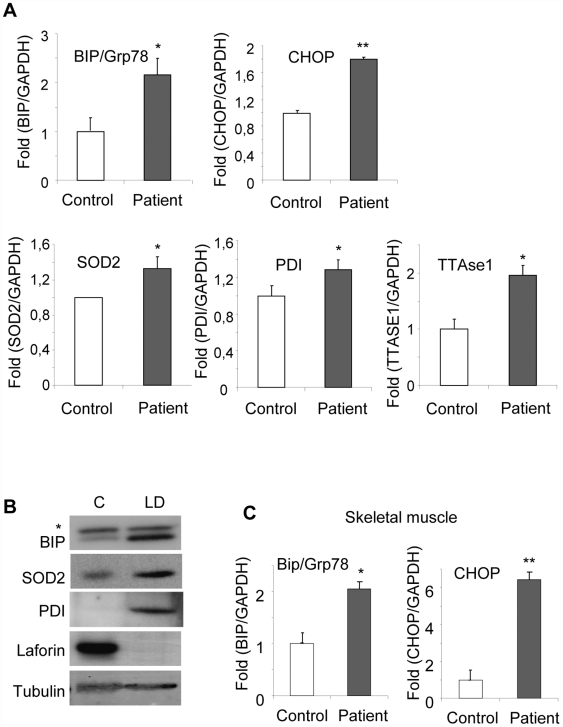
Figure 5. Expression of ER-stress markers is increased in brain necropsies of a LD patient.
A) Quantitative-real time PCR analysis of ER-stress markers in brain necropsies from both control and LD patient. Expression of target genes was normalized using GAPDH as an internal control. Data are expressed as fold induction over control (mean±SEM) of four independent measurements. B) Extracts from brain necropsies from both control and LD patient were analyzed by western blot using the indicated antibodies. Membranes were probed with anti-tubulin antibodies to ensure equal protein loading. * non-specific band. C) Quantitative-real time PCR analysis of ER-stress markers in skeletal muscle necropsies from both control and LD patient. Expression of target genes was normalized using GAPDH as an internal control. Data are expressed as fold induction over control (mean±SEM) of four independent measurements.

