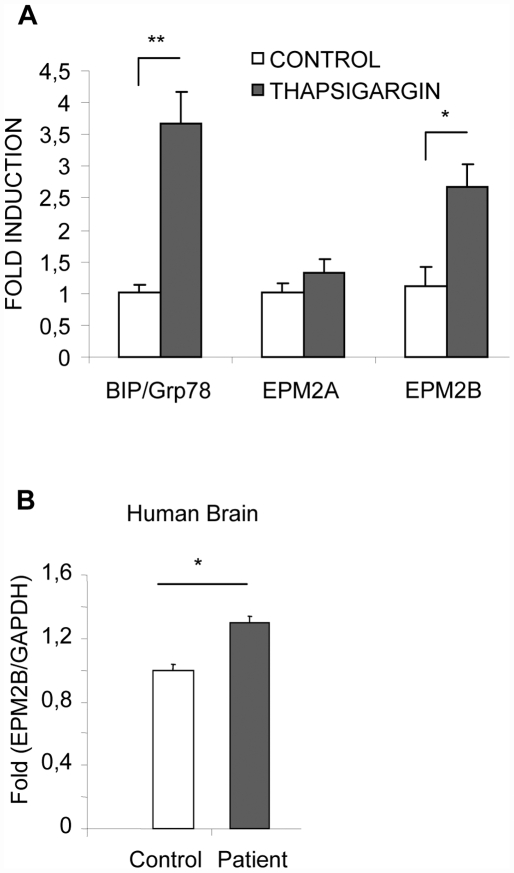
Figure 6. Malin expression is induced under conditions of ER-stress.
A) SH-SY5Y cells were treated or not with 1 µM thapsigargin for 18 h and levels of mRNAs were measured by quantitative-real time PCR. Expression of target genes was normalized using GAPDH as an internal control. Data are expressed as fold induction over untreated cells (mean±SEM) of three independent measurements. B) Quantitative-real time PCR analysis of EPM2B gene expression in brain necropsies from both control and LD patient normalized using GAPDH as an internal control. Data are expressed as fold induction over control (mean±SEM) of two independent measurements.

