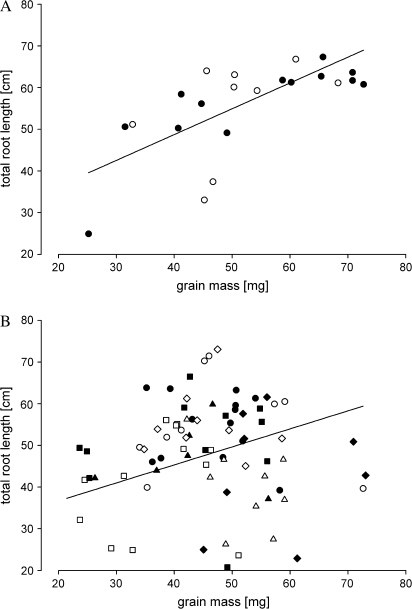
Fig. 1.
Relationship between total root lengths measured at 30 d and grain mass for (A) control (rht) cv. Mercia (open circles) and cv. Maris Widgeon control (rht) (filled circles). The line is the linear regression (y=0.619x+23.959; r2=0.48).(B) Semi-dwarf and dwarf NILs in cv. Mercia Rht-B1b (open circles), Rht-D1b (filled circles), Rht-B1c (open squares), Rht8c (filled squares), Rht-D1c (open triangles), Rht12 (filled triangles) and in cv. Maris Widgeon Rht-B1b (open diamonds), Rht-B1c (filled diamonds). The line is the linear regression (y=0.4320x+28.0470; r2 = 0.12).

