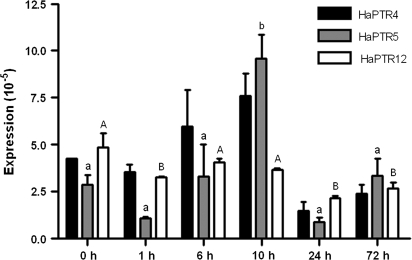
Fig. 6.
Time course of HaPTR expression in cluster roots. Expression levels were determined with quantitative real-time PCR and standardized using 18S rRNA. Plants were grown hydroponically in the glasshouse under nutrient starvation for 7 months and resupplied for 1, 6, 19, 24, and 72 h with protein as the N source. Data represent averages and the SD of three independent samples (two replicates where no SD is shown). Significant differences (P <0.05, one-way ANOVA, Tukey's post hoc test) are indicated with lower case (HaPTR5) and upper case letters (HaPTR12).

