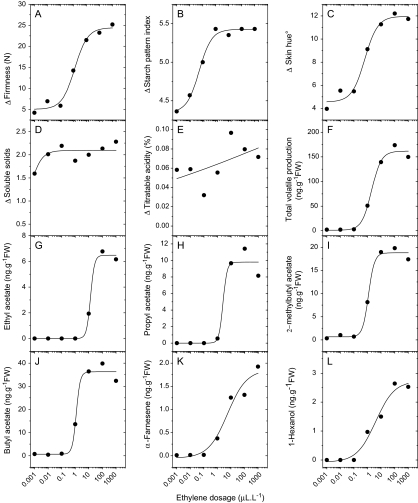
Fig. 4.
Response curves of different ripening characters for MdACO1as fruit treated with different concentrations of ethylene. Flesh firmness (A) starch pattern index (B), skin background colour (C), soluble solids concentration (D), titratable acidity (E), total volatiles (F), and individual volatiles (G–L). Each point depicts the mean of 14 fruit.

