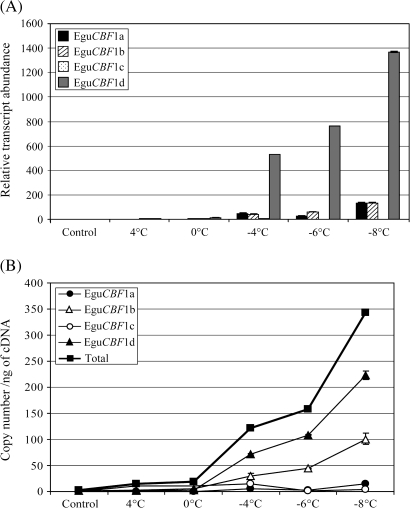
Fig. 4.
Response of EguCBF1 genes to exposure to progressive freezing. Four leaves picked from two plantlets were exposed to a cooling programme in two steps: first from 22 °C to 4 °C with a speed of –1 °C h−1, followed by freezing from 4 °C to –8 °C with a speed of –2 °C h−1 (at –1 °C ice was added). During the cooling programme, leaves were collected at 4 °C, 0 °C, –4 °C, –6 °C, and –8 °C for total RNA extraction. Relative transcript abundance (A) and copy number ng−1 of cDNA of EguCBF1 genes (B) were determined using RT-qPCR as described in the legend of Fig. 2 and in the Materials and methods. For transcript copy number ng−1 of cDNA values, closed circles, open triangles, open circles, closed triangles, and closed squares correspond to EguCBF1a, EguCBF1b, EguCBF1c, EguCBF1d genes, and the total amount of the EguCBF1 genes, respectively.

