
Fig. 2. Region-specific expression of ADARs in the adult mouse.
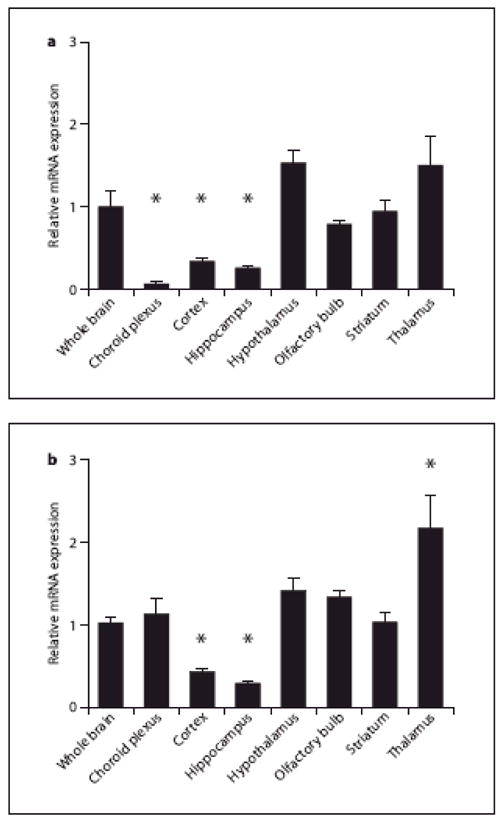
The relative expression of ADAR1 (A) and ADAR2 (B) mRNA was quantified by qPCR in mouse whole brain, and in dissected brain regions. For each region, values are expressed as mean ± SEM and normalized to the expression value observed in whole brain samples. A) Choroid plexus, cortex and hippocampus ADAR1 mRNA levels are significantly different that whole brain mRNA (individual t-test, Bonferroni post-hoc analyses). B) Cortical, hippocampal and thalamic ADAR2 transcripts are significantly different than whole brain transcripts (individual t-test, Bonferroni post-hoc analyses), *: p<0.001.