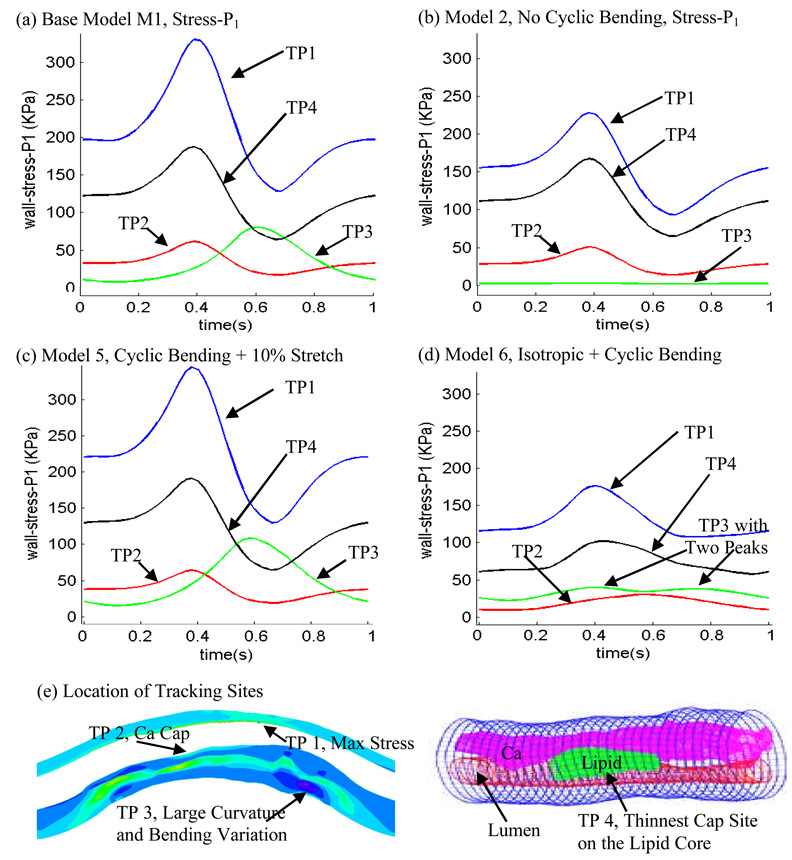
Figure 10.
Local Stress-P1 variations tracked at four selected locations from four models showing cyclic bending causes large stress variations in the coronary plaque. TP1: a location where global maximum Stress-P1 was found; TP2: calcification plaque cap (thinnest site); TP3: a location on the bending side with a large local curvature; TP4: lipid pool plaque cap.

