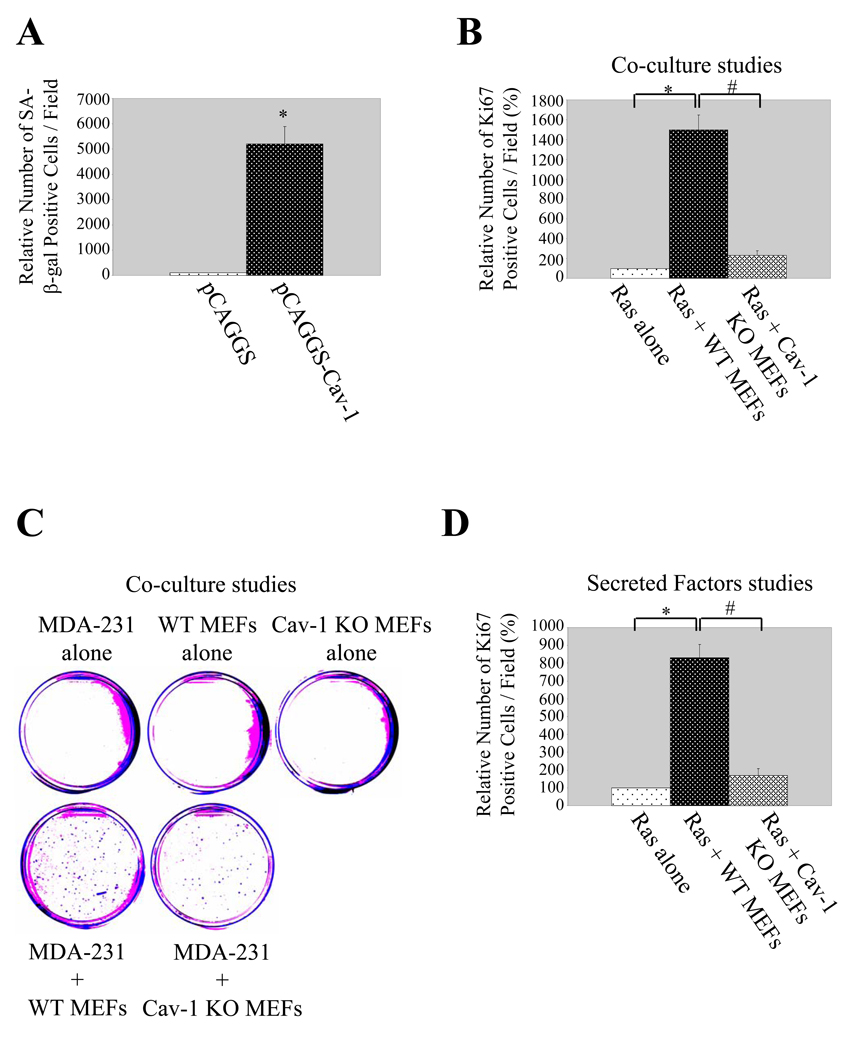
Figure 5. Caveolin-1 induces senescence of cancer cells and mediates senescent fibroblast-induced proliferation of cancer cells in vitro and in vivo.
(A) Senescence-Associated (SA) β-galactosidase activity assay. Caveolin-1-and pCAGGS-expressing cells were derived as described in Supplementary Figure 5A. Cells were then subjected to senescence-associated β-galactosidase activity assay. Quantitation of the SA-β-galactosidase activity assay is shown. Values represent means ±SEM. *P<0.001.
(B). Co-culture studies using RasG12V-transformed NIH 3T3 cells. RasG12V-transformed NIH 3T3 cells were cultured alone or with either wild type or caveolin-1 null MEFs as described in Materials and Methods. Cells were then stained with anti-Ki67 mAb. Ki67 staining was detected using fluorescent secondary antibodies. Quantification of Ki67 staining is shown. Values represent means ± SEM. *, #P<0.001.
(C) Co-culture studies using MDA-MB-231 cells. MDA-MB-231 cells were cultured alone or with either wild type or caveolin-1 null MEFs as described in Materials and Methods. Colony formation was then detected by staining the cells with crystal violet (A representative image is shown in (C); quantification of the staining is represented in Supplementary Figure 5F).
(D) Secreted factors studies. RasG12V-transformed NIH 3T3 cells were grown with secreted factors from hydrogen peroxide-treated wild type and caveolin-1 null MEFs as described in Materials and Methods. Cells were then stained with anti-Ki67 mAb. Ki67 staining was detected using fluorescent secondary antibodies. Quantification of Ki67 staining is shown. Values represent means ± SEM. *, #P<0.001.

