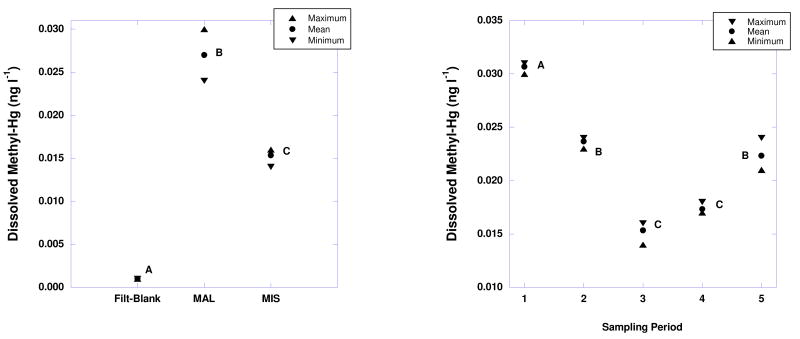
Figure 3.
(Left) Maximum, mean, and minimum methylHg concentrations of 3 field-replicate samples from Malletts Bay (MAL) and Missisquoi Bay (MIS) of Lake Champlain June 25th, 2008. The maximum, mean, and minimum concentrations of the laboratory filtration-step blank are included for comparison. ANOVA indicated significant differences between the blanks and samples (Prob > F, <0.0001). Different letters indicate significant differences between the means based on all pairs using Tukey-Kramer HSD (p < 0.01). (Right) Maximum, mean, and minimum methylHg concentrations of 3 field-replicate samples from Missisquoi Bay, Lake Champlain over the course of 5 bi-weekly samplings in 2008. ANOVA indicated significant differences between the sampling dates (Prob > F, <0.0001). Different letters indicate significant differences between the means based on all pairs using Tukey-Kramer HSD (p < 0.01).

