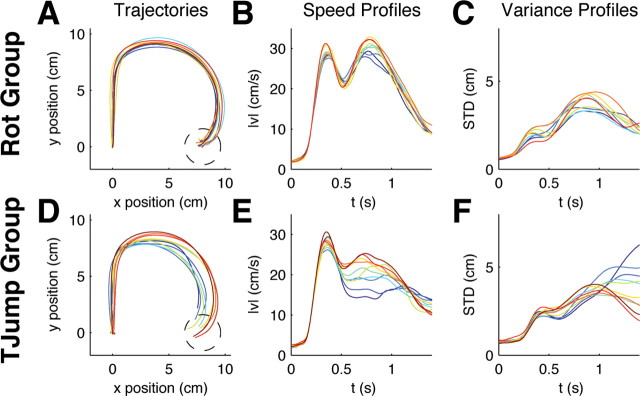
Figure 4.
Evolution of within-trial adaptation and control for ±90° random rotations in the second block of 2000 trials. A, Movement trajectories averaged over batches of 200 trials for the group that had experienced unexpected rotation trials already in the previous 2000 trials. Dark blue colors indicate early batches, red colors indicate later batches. This group shows no improvement. B, Speed profiles of the same trial batches. C, SD in the same trials. There is no trend over consecutive batches. D, Average movement trajectories averaged over batches of 200 trials for the group that had experienced unexpected target jump trials in the previous 2000 trials. This group shows learning. E, Speed profiles of the target jump group. F, SD in the same trials. The movement characteristics change over consecutive batches.

