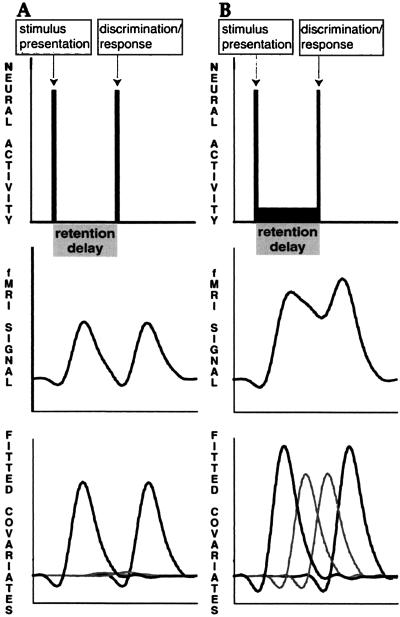
Figure 2.
Individual analysis logic. A depicts a brief period of neural activity (Top) associated with both encoding and the response components, with no increase above baseline during the delay. Such neural activity change leads to a profile of fMRI signal change (Middle). The model covariates (shifted impulse-response functions) scaled by their resulting least-squares coefficients are shown at Bottom (gray lines, delay covariates; black lines, encoding and response covariates). The covariates modeling the delay make only a small contribution to variance explanation in A. In B, there is some neural activity increase relative to baseline during the delay. It can be seen that in B, the delay covariates explain more variance in the fMRI signal than in A.

