
Figure 3.
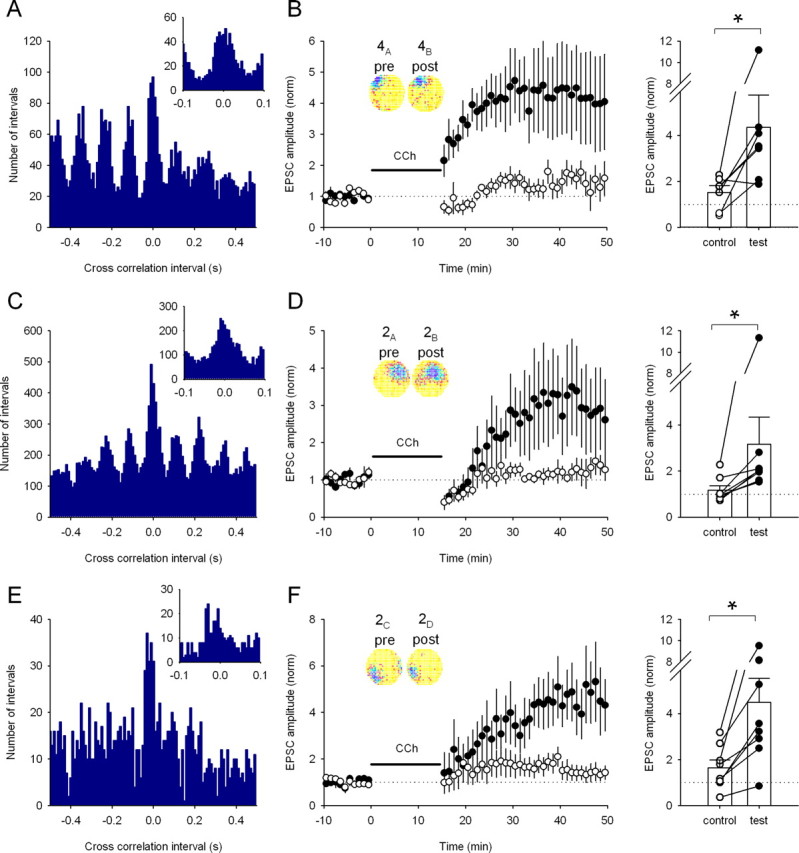
A range of place cell pairs with overlapping firing fields induce LTP (A). Cross-correlation histogram for a pair of CA3 and CA1 place cells (4A,B) with overlapping fields (10 ms bins). Inset, The same data using 5 ms bins showing many intervals <20 ms. B, Replay of the cell pair 4A,B induces test pathway-specific LTP in a similar manner to overlapping CA1 place cell pairs (control path, 151 ± 31%; test path, 436 ± 140%; n = 6 cells; p < 0.05). Inset, Firing rate maps showing the similarity of the two firing fields. Right, The change in EPSC amplitude for each pathway in each experiment. *p < 0.05. C, Cross-correlation histogram for a second place cell pair (2A,B) with overlapping fields (10 ms bins). Inset, The same data with 5 ms bins. D, Replay of activity from pair 2A,B in the presence of carbachol induces pathway-specific LTP (control path, 117 ± 19%; test path, 317 ± 117%; n = 8 cells; p < 0.05). Inset, Firing rate maps showing the similarity of the two firing fields. Right, Change in EPSC amplitude for each pathway in each experiment. *p < 0.05. E, Cross-correlation histogram for a third place cell pair (2C,D) with overlapping fields (10 ms bins). Inset, The same data using 5 ms bins. F, Replay of activity from pair 2C,D also induces pathway-specific LTP in the presence of carbachol (control path, 165 ± 33%; test path, 449 ± 105%; n = 8 cells; p < 0.05). Inset, Firing rate maps showing the similarity of the two firing fields. Right, Change in EPSC amplitude for each pathway in each experiment. *p < 0.05.