
Figure 1. Over- or under-expression of tissue-specific transcripts is quantified using a rank-sum statistic corrected to 0.05 false discovery rate.
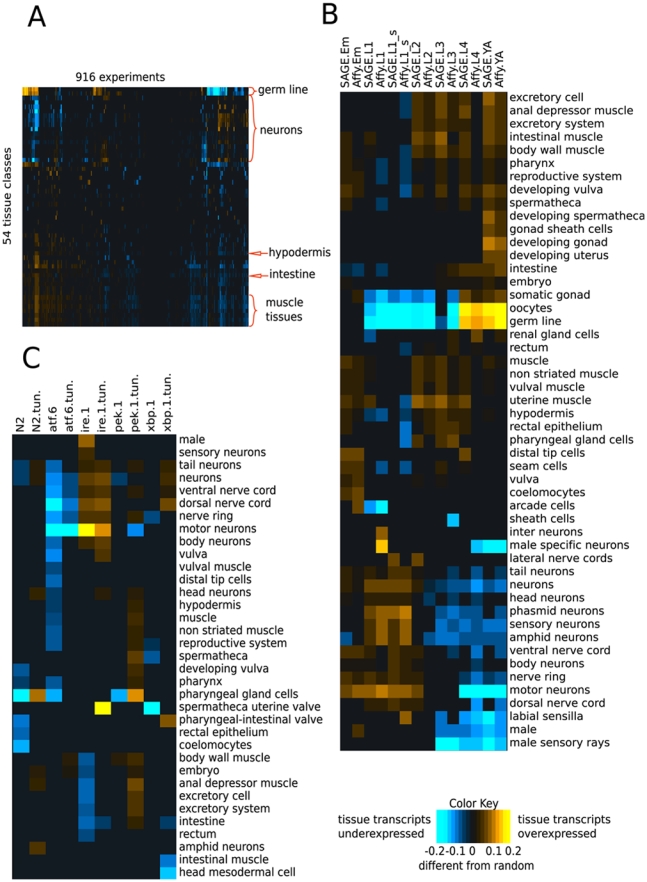
Tissues with no significant results are omitted. (A) A global view of all microarray experiments (clustered on both axes). Significant tissue biases can be observed across the compendium, with neuronal and germ line signals being especially prevalent. Yellow square for a specific tissue and condition combination indicates that genes known (in our gold standard, see Methods) to be expressed in that tissue are over-expressed -(as compared to background) in that microarray condition. (B, C) Detailed views of parts of the matrix in (A). (B) Levels of over- or under-expression of tissue-specific transcripts in developmental time course experiments on SAGE and Affymetrix platforms [24] (clustered on both axes). Over- and under-expression of tissue-specific genes coincides with the timing of tissue development. (C) Levels of over- or under-expression of tissue-specific transcripts in the unfolded protein response study Shen et al. [25] (clustered on the y axis). Mutations in the UPR pathway genes invoke tissue-specific responses. Treatment with tunicamycin is denoted as (tun.).