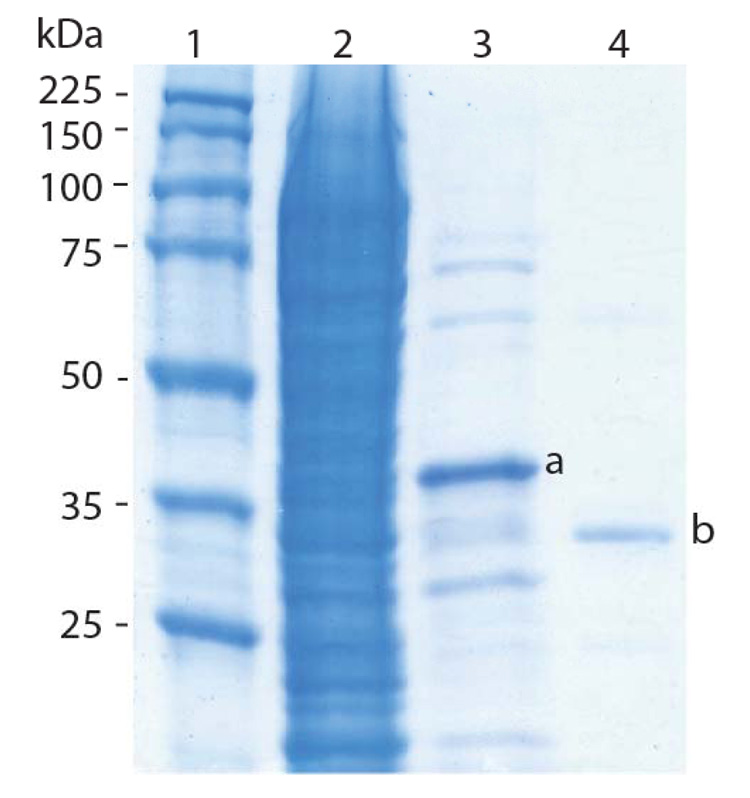
Figure 1.
SDS-PAGE analysis of rSET purification. Lane 1: Molecular weight markers; lane 2: E. coli cell lysate; lane 3: after Ni2+-TED-resin affinity chromatography and lane 4: after soybean trypsin inhibitor affinity chromatography. The protein bands labeled are Histag-proSET (a) and mature rSET (b).

