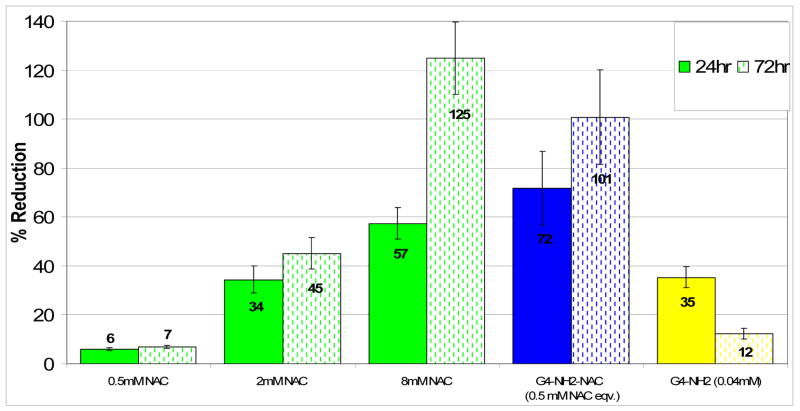
Figure 11.
ROS Assay, Percent Reduction in H2O2 levels with 24 hr NAC, PAMAM-S-S-NAC or dendrimer treatment with simultaneous induction by LPS stimulation. 100% reduction denotes H2O2 concentration of cells with no induction by LPS (control group). The amount of ROS released into the media was measured using Amplex Red. Data are mean ± SD of three samples per group, and assessed by t test. For the free dendrimer, equivalent concentrations of the dendrimer that correspond to the amount present in the conjugate at the given NAC concentration are shown in bracket.

