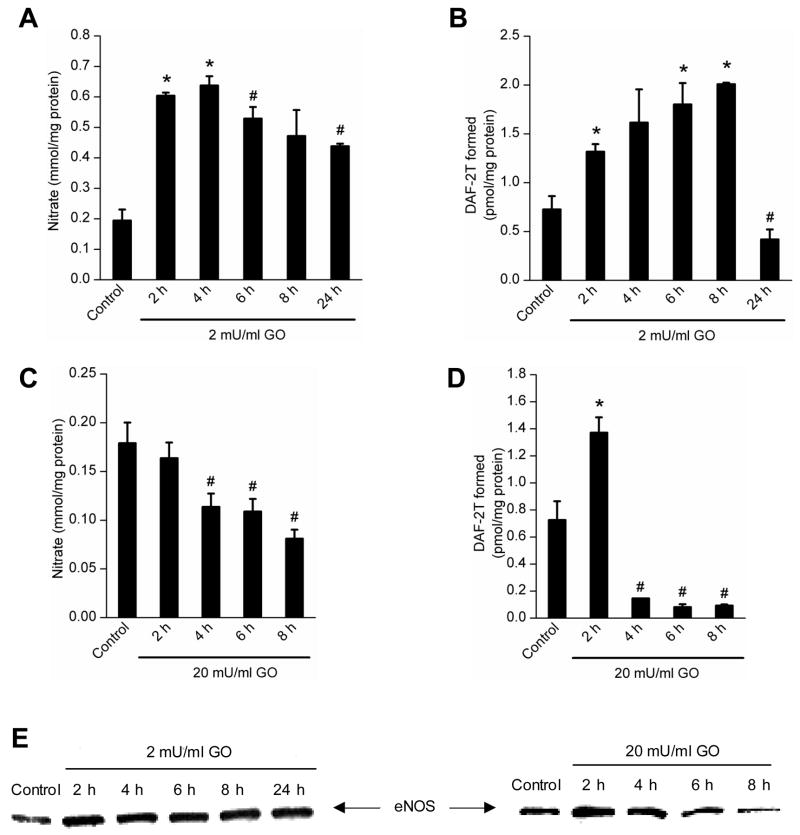
Figure 5.
Measurements of nitrate and DAF-2T in cells treated with low and high levels of GO. A and B, BAEC were treated with 2 mU/ml of GO for different time periods and nitrate release (A) and intracellular DAF-2T levels (B) were measured. C and D, Same as above, except that cells were treated with GO (20 mU/ml) and nitrate (C) and DAF-2T (D) measured as described in Materials and Methods. E, Immunoblots of eNOS protein measured in cell lysates after treatment with 2 and 20 mU/ml of GO. * p < 0.05 as compared to control; # p < 0.05 as compared to 4 h (A), 6 h (B) and 2 h (C and D) incubation with GO.

