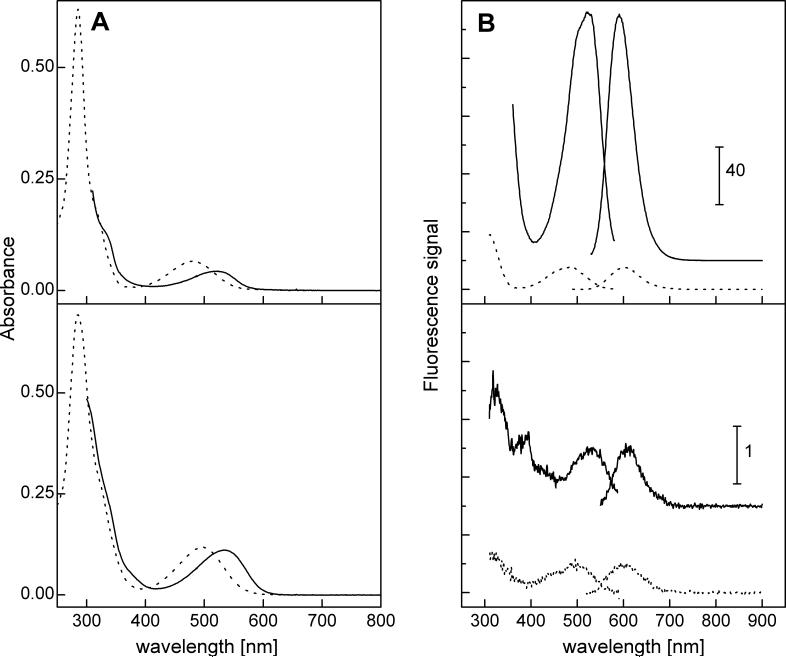
Figure 9.
Spectroscopic properties of ethidium (E+) and diethidium (E+-E+). (A) Absorption spectra of E+ (10 μM) (upper panel) and E+-E+ (10 μM) (lower panel) in the absence (dotted line) and presence of 1 mg/ml of DNA (from salmon testes) (solid line) in Tris-EDTA buffer (pH 7.4). (B) Fluorescence excitation (left) and emission (right) spectra of 10 μM of E+ (upper) and 10 μM E+-E+ (lower panel) in the absence (dotted line) and presence of DNA (solid line) in Tris-EDTA buffer (pH 7.4). Note the difference in the relative fluorescence scale between the upper and lower fluorescence spectra. The spectra have been corrected by subtracting the corresponding blank solution containing only the appropriate amount of DMSO.

