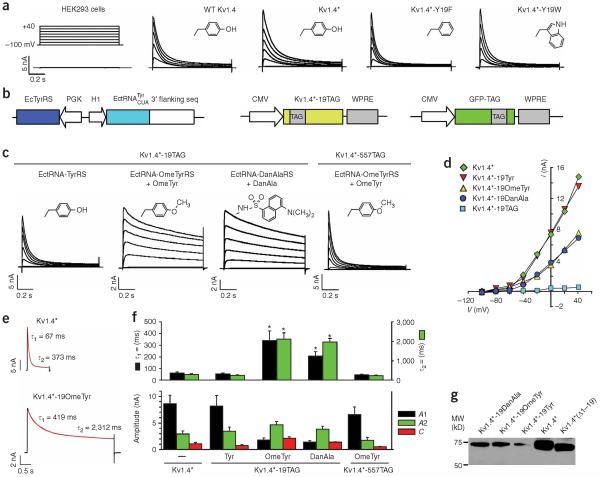
Figure 5.
Probing N-type inactivation using unnatural amino acid mutagenesis with Kv1.4 channels expressed in mammalian cells. (a) Comparison of macroscopic currents recorded from HEK293 cells expressing wild-type Kv1.4, Kv1.4⋆ (Kv1.4-M109L), Kv1.4⋆-Y19F or Kv1.4⋆-Y19W channels. Untransfected HEK293 cells displayed a small, background current (0.50 ± 0.03 nA, n = 5). Inserts in each panel show the side-chain structures of amino acids at position 19. (b) Constructs for expressing Kv1.4 through amber suppression. The GFP-TAG reporter plasmid was used as an indicator for transfection. (c) Potassium currents recorded from HEK293 cells expressing Kv1.4⋆-TAG channels through amber suppression using the indicated orthogonal tRNA-synthetase pair. Only background currents were recorded for Kv1.4⋆-19TAG alone (0.40 ± 0.05 nA, n = 5) or Kv1.4⋆-TAG with the EctRNA-OmeTyrRS pair in the absence of OmeTyr (0.42 ± 0.07 nA, n = 4). The Kv1.4⋆-19OmeTyr and Kv1.4⋆-19DanAla mutants exhibited significantly slower inactivation than Kv1.4⋆ and Kv1.4⋆-19Tyr. Inserts in each panel are the side chain structures. (d) Peak current plotted as a function of voltage for the indicated Kv1.4 channels. (e) Current (black trace) elicited by a 1-s (Kv1.4⋆) or 4-s (Kv1.4⋆-19OmeTyr) voltage step to +20 mV were fit with a sum of two exponentials (red line) relaxing to a small steady-state current with the indicated time constants. (f) Quantitative analysis of inactivation kinetics. Bar graphs show the average time constants (τ1, τ2) for the fast and slow inactivation components, current amplitudes (A1, A2) for the exponentials and steady-state current (C). Specific values are in Table 1. Asterisks indicate statistical difference from Kv1.4⋆ (P < 0.05). (g) Western blot analysis of Kv1.4⋆-19OmeTyr and Kv1.4⋆-19DanAla. The full-length Kv1.4⋆, Kv1.4⋆-19Tyr, and a truncated Kv1.4⋆ with the first 19 amino acid residues deleted were run as controls.

