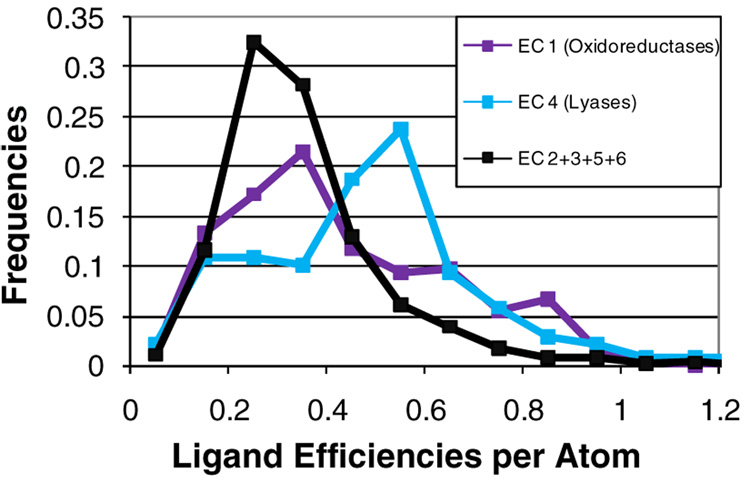
Figure 6.
Distribution of ligand efficiencies (–kcal/mol-atom) for enzymes, given in percent frequencies normalized for the different number of complexes in each enzyme class. The distribution of transferases (EC 2, 468 complexes), hydrolases (EC 3, 843 complexes), isomerases (EC 5, 60 complexes), and ligase (EC 6, 17 complexes) are the same and have been added together for this example (black line). Oxidoreductases (EC 1, purple line, 256 complexes) have larger populations in the higher efficiencies (p<0.0001). The distribution of lyases (EC 4, blue line, 139 complexes) is notably shifted (p<0.0001).

